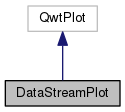
The DataStreamPlot display a series of data streams into the plot storing all the history of the data pushed into the DataStreamPlot during time. More...
Public Slots | |
| void | updatePlot () |
| recalculate the x and y scale axis and replot the data More... | |
Public Member Functions | |
| DataStreamPlot (QWidget *parent=0) | |
| constructor an empty LiveDataPlot without any data More... | |
| virtual | ~DataStreamPlot () |
| destructor More... | |
| int | addDataStream (QString name) |
| add a new stream to the plot More... | |
| void | appendData (int streamID, float value) |
| append a point to the stream specified More... | |
| void | setDataStreamColor (int streamID, QColor color) |
| set the color of the stream specified More... | |
Detailed Description
The DataStreamPlot display a series of data streams into the plot storing all the history of the data pushed into the DataStreamPlot during time.
- Warning
- this class is not thread-safe; if you need to append data in a multi-thread scenario, use DataStreamsWidget
Definition at line 39 of file datastreamplot.h.
Constructor & Destructor Documentation
| DataStreamPlot | ( | QWidget * | parent = 0 | ) |
constructor an empty LiveDataPlot without any data
Definition at line 63 of file datastreamplot.cpp.
References DataStreamPlot::updatePlot().
|
virtual |
destructor
Definition at line 93 of file datastreamplot.cpp.
Member Function Documentation
| int addDataStream | ( | QString | name | ) |
add a new stream to the plot
- Parameters
-
name is the name of the stream (it will be displayed on the legend) onLeft if true the Y axis regarding this curve will be the left one, if false will be the right one
- Returns
- the id of the newly created stream
Definition at line 99 of file datastreamplot.cpp.
| void appendData | ( | int | streamID, |
| float | value | ||
| ) |
append a point to the stream specified
- Parameters
-
streamID is the id identifying the stream to which the data will be added value is the new data value to append to the stream
- Note
- this method does not trigger any reploting and/or widget update; you have to call updatePlot
Definition at line 115 of file datastreamplot.cpp.
| void setDataStreamColor | ( | int | streamID, |
| QColor | color | ||
| ) |
set the color of the stream specified
- Parameters
-
streamID is the id identifying the stream to which apply the color color to apply to the plotted data
Definition at line 109 of file datastreamplot.cpp.
|
slot |
recalculate the x and y scale axis and replot the data
Definition at line 129 of file datastreamplot.cpp.
References farsa::max(), and farsa::min().
Referenced by DataStreamPlot::DataStreamPlot().
The documentation for this class was generated from the following files:
- utilities/include/datastreamplot.h
- utilities/src/datastreamplot.cpp